Legacy SAP landscapes often struggle to meet modern analytics demands, limiting agility and inflating costs. Migrating to Microsoft Fabric addresses these gaps, yet success hinges on careful planning. This article explores the business case, readiness assessments, target architecture, migration strategies, and change management-equipping you to modernize confidently and measure real ROI.
Why Migrate from SAP to Microsoft Fabric
SAP’s legacy data landscape, built on SAP ECC, BW, and HANA, often struggles with siloed data, high maintenance costs, and limited scalability, driving enterprises to consider Microsoft Fabric as a unified analytics platform.
Fabric consolidates data engineering, warehousing, and business intelligence into a single SaaS environment. Instead of stitching together separate SAP and Azure tools, teams work from one Lakehouse built on OneLake and Delta Lake.
The result is lower total cost of ownership, faster delivery of insights, and tighter alignment between ERP data and analytics. These three drivers, cost, agility, and integrated analytics, form the core of the migration business case.
Limitations of Legacy SAP Data Landscapes
SAP ECC and BW systems often create data silos, require specialized ABAP skills, and incur high TCO. IDC reports that SAP customers spend up to 60% of IT budgets on maintenance.
These limitations surface in several consistent ways across enterprise environments:
- Data silos across modules. FI, SD, and MM data sit in separate structures, so cross-functional reporting demands heavy reconciliation before any insight emerges.
- Rigid extraction logic. BW extractors and ABAP programs are slow to change. A new field or business rule can trigger weeks of development and regression testing.
- Poorly scaling costs. HANA licensing and hardware scale linearly with data growth, and specialized skills add further expense.
- Weak native integration. Connecting SAP data to Azure Data Factory, Power BI, or Microsoft Purview typically requires custom middleware and duplicate pipelines.
Each limitation compounds the next: silos demand extraction logic, extraction logic demands specialists, and specialists drive up cost. The business case for migration follows directly from removing these constraints.
Business Case and Expected ROI
A typical SAP-to-Fabric migration can reduce TCO by 30-50% over three years, with payback in 12-18 months, according to Microsoft case studies. The savings come from replacing fixed SAP infrastructure with elastic Fabric capacity.
Fabric capacity uses F-SKU pricing, while OneLake storage is billed separately and scales with actual usage. SAP BW and HANA, by contrast, carry license, hardware, and personnel costs that grow regardless of demand.
| Cost Category | SAP (Annual) | Fabric (Annual) | Savings |
|---|---|---|---|
| Platform licenses | $300K | $150K | $150K |
| Infrastructure and hardware | $120K | $60K | $60K |
| Specialist personnel | $180K | $90K | $90K |
| Total (example: BW vs F64) | $600K | $300K | $300K |
ROI drivers extend beyond the table. Eliminating SAP extractor maintenance frees ABAP capacity, reducing data duplication cuts storage and reconciliation effort, and faster time-to-insight shortens decision cycles.
A retail company cut reporting costs by 40% and improved query performance 5x after moving to Fabric, according to published Microsoft case studies. Similar patterns appear across manufacturing and finance, where DirectLake semantic models replace slow BW queries.
Assessing Your SAP Estate and Readiness
Before migrating, inventory all SAP data sources, ECC tables, BW infocubes, HANA views, and third-party systems, to map dependencies and assess governance gaps. A thorough audit reveals how data flows across SAP ERP modules and which downstream reports depend on them.
This phase also exposes weaknesses in data governance and security controls that could complicate the move to Microsoft Fabric. Skipping it often leads to broken pipelines and compliance surprises later.
The two subsections below cover the practical steps for cataloging sources and meeting regulatory obligations.
Data Source Inventory and Dependency Mapping
Use SAP’s Data Dictionary (DD03L) and Microsoft Purview to catalog 500+ tables and 200+ CDS views, identifying dependencies between SAP modules and downstream reports. This baseline prevents surprises when building Fabric pipelines.
Start by extracting metadata from SAP systems. Transaction SE11 and SAP PowerDesigner surface table structures, while SAP Solution Manager or erwin map how objects connect across modules.
- Extract metadata using SE11, DD03L, or PowerDesigner.
- Map dependencies with Solution Manager or erwin.
- Classify data by criticality, such as financial versus operational.
- Document lineage in Microsoft Purview for ongoing tracking.
A simple tracking template keeps the effort organized:
| Data Source | Type | Owner | Dependencies | Migration Priority |
|---|---|---|---|---|
| VBAK | ECC Table | Sales Ops | BW extractors, Power BI reports | High |
| 0FI_GL_4 | BW Infocube | Finance | CDS views, BO reports | High |
| Z_CUSTOM | ABAP Custom | IT | IDoc interfaces | Medium |
Watch for common pitfalls. Custom ABAP code and IDoc interfaces are frequently overlooked, yet they often carry critical business logic that must be replicated in Fabric data pipelines.
Governance, Security, and Compliance Requirements

Ensure compliance with GDPR and SOX by implementing row-level security in Fabric and using Microsoft Purview for data classification and lineage. These controls must be defined before migration begins, not retrofitted afterward.
Key requirements to address include:
- Data residency: confirm whether data must remain in EU or US regions.
- Role-based access control: map SAP roles to Microsoft Entra ID groups and Fabric workspace roles.
- Data masking: apply dynamic data masking for PII fields such as customer names or bank details.
- Audit trails: maintain logs that satisfy SOX reporting obligations.
- Encryption: enforce encryption at rest and in transit, with keys managed in Azure Key Vault.
Microsoft Purview handles classification and lineage, while Azure Key Vault secures credentials and encryption keys. A practical checklist helps teams verify each control before go-live.
Consider how one bank approached this. By mapping existing SAP authorization roles directly to Fabric workspace roles, the team maintained segregation of duties and produced the audit evidence SOX auditors required. This role mapping exercise also simplified onboarding for new analysts, since familiar access patterns carried over into the new platform.
Target Architecture on Microsoft Fabric
Design a target architecture on Fabric that unifies SAP data into OneLake, leveraging Lakehouses for raw data and Warehouses for curated models. This approach replaces fragmented SAP BW, SAP HANA, and SAP BusinessObjects landscapes with a single SaaS analytics platform.
The core rests on three components. OneLake acts as the tenant-wide foundation, holding all data in open Delta Lake format. Lakehouses provide schema-on-read flexibility for raw and cleansed SAP extracts, while the Warehouse delivers full T-SQL analytics over curated dimensional models.
This layering supports enterprise modernization without rebuilding every SAP extractor at once. Existing SAP Data Services jobs, SLT replication, and ODP extractors can feed OneLake incrementally. Teams then re-architect downstream reporting at their own pace, reducing migration risk and protecting continuity for finance and supply chain users.
OneLake, Lakehouses, and Warehouse Design
In Fabric, store raw SAP data in a Lakehouse using Delta Parquet format, then curate into a Warehouse with star schema for Power BI DirectLake. The medallion pattern organizes this into three zones.
- Bronze layer: raw SAP ERP and S/4HANA extracts land as Delta tables. Keep source fidelity, including IDoc payloads, BAPI outputs, and CDS view results.
- Silver layer: cleansed, conformed, and deduplicated data. Apply data quality rules, master data management alignment, and ABAP field decoding here.
- Gold layer: dimensional models in the Warehouse. Star schema tables serve semantic models directly.
The flow follows a simple path: OneLake feeds the Lakehouse for Bronze and Silver, and the Warehouse holds Gold. Partitioning by fiscal period aligns with SAP reporting cycles and keeps incremental loads efficient. Parquet suits cold archival storage, while Delta Lake is preferred for active tables because it supports ACID transactions, time travel, and change data capture.
Use OneLake shortcuts to avoid duplicating data across workspaces. A shortcut points to existing Delta folders without copying bytes, which lowers storage cost and keeps lineage intact in Microsoft Purview. Optimize table layout for DirectLake by sorting on common join keys, compacting small files, and avoiding unnecessary columns. These steps let Power BI read Delta files directly without Import mode refreshes or DirectQuery overhead.
Data Factory, Synapse, and Power BI Integration
Use Data Factory pipelines to ingest SAP data via ODBC or SAP connectors, Synapse for big data processing, and Power BI for visualization with DirectLake. Each service shares the same Fabric capacity, so orchestration, transformation, and reporting run on one billable platform.
Data Factory handles orchestration. A copy activity pulls from SAP extractors, ODP, or SLT targets into OneLake Bronze tables. A minimal pipeline definition looks like this:
{ "name": "SAP_to_Bronze "activities": [{ "name": "CopySAPExtract "type": "Copy "source": { "type": "SapTable "table": "VBAK" }, "sink": { "type": "LakehouseTable "table": "bronze_vbak" } }] }Synapse Spark notebooks then transform Silver and Gold layers using PySpark. A typical cleansing step filters invalid records and casts types:
df = spark.read.format("delta").load("Tables/bronze_vbak") clean = df.filter(df.MANDT == "100").withColumn("ERDAT to_date("ERDAT")) clean.write.format("delta").mode("overwrite").saveAsTable("silver_vbak")Power BI semantic models consume Gold tables through DirectLake, giving near-Import performance without scheduled refreshes. In one representative use case, a company reduced ETL time from 8 hours to 1 hour by replacing legacy SAP Data Services chains with Data Factory pipelines and Spark notebooks. Governance stays centralized through Microsoft Purview for lineage and Microsoft Entra ID for row-level and column-level security.
Migration Approaches and Tooling
Choose between batch and real-time replication based on data volume and latency requirements, using tools like SAP Landscape Transformation (SLT) or Qlik Replicate. Each approach shapes how data lands in OneLake and how quickly downstream semantic models refresh.
Batch suits high-volume historical loads and master data, while real-time streaming serves operational reporting and event-driven scenarios. Many teams blend both to balance cost, source system load, and freshness.
The following sections detail replication strategies and the accelerators, connectors, and automation that speed up an SAP to Microsoft Fabric migration.
Batch vs. Real-Time Replication Strategies
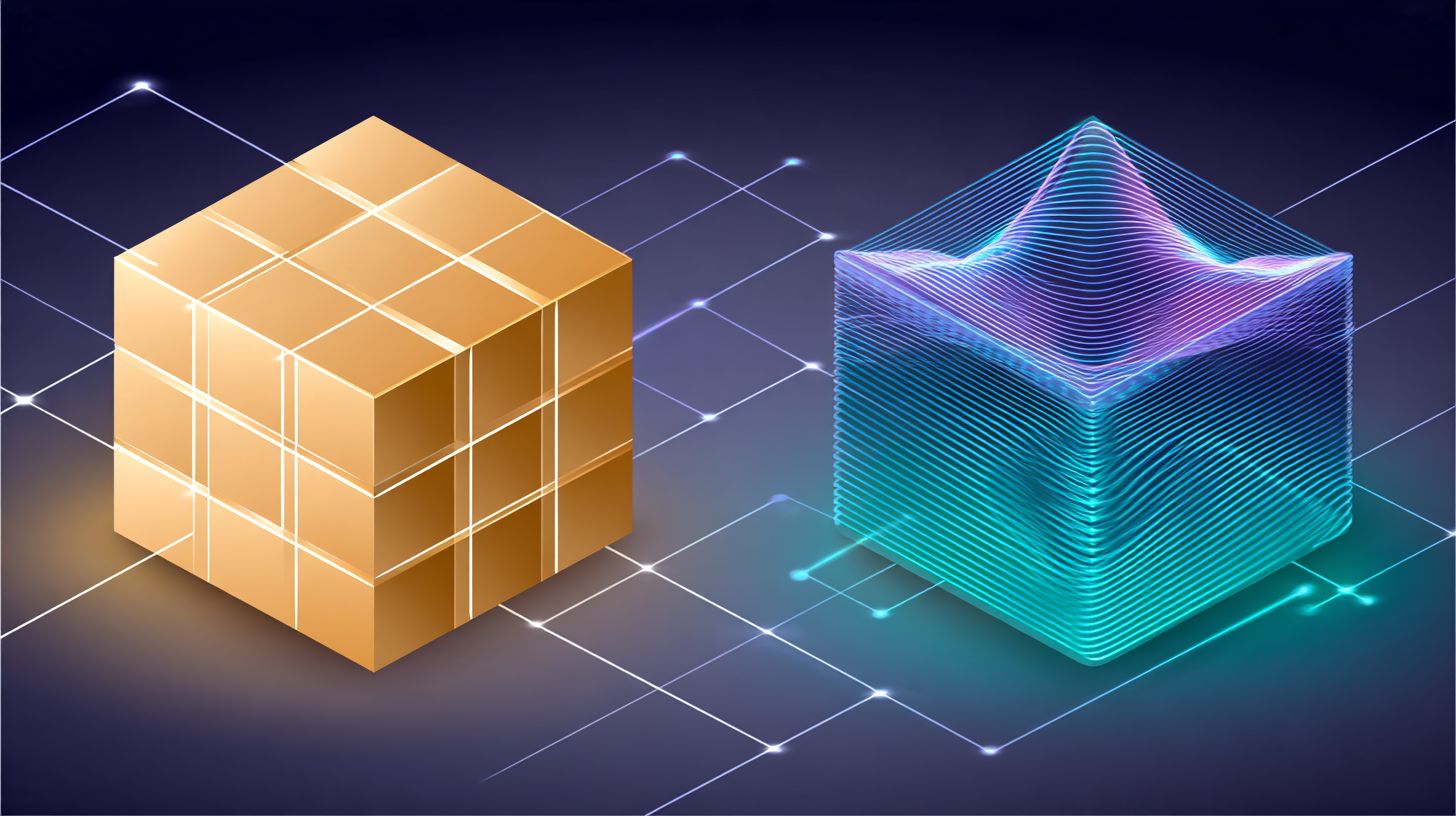
For large SAP tables like BKPF (accounting documents), batch extraction via ODP is cost-effective, while real-time CDC using SLT is ideal for order-to-cash processes. The right choice depends on how fresh the data must be and how much load the source can tolerate.
| Strategy | Latency | Volume | Tools | Use Case |
|---|---|---|---|---|
| Batch | Hourly or daily | High | ODP, ABAP extractors | Historical and master data |
| Real-time | Seconds | Low to moderate | SLT, CDC | Operational reporting |
Decision criteria include data freshness needs, source system load, and cost. Real-time CDC reduces SAP impact by reading change logs, but SLT setup adds complexity and licensing overhead.
A hybrid approach works well. Run nightly batch for master data such as customer records, and use real-time CDC for transactional data like sales orders. This keeps latency low where it matters and controls cost elsewhere.
Accelerators, Connectors, and Automation
Leverage pre-built accelerators like Microsoft’s SAP CDC connector for Fabric and third-party tools like Theobald Xtract Universal to reduce migration time considerably. These tools handle extraction logic so teams focus on modeling and governance.
| Tool | Type | Price | Key Features | Best For |
|---|---|---|---|---|
| Microsoft SAP CDC connector | Native Fabric connector | Free with Fabric | CDC ingestion into OneLake | Teams already on Fabric |
| Theobald Xtract Universal | Third-party extractor | $10K+ | Broad SAP source support | Mixed SAP landscapes |
| Qlik Replicate | CDC replication | $20K+ | Real-time replication | Low-latency pipelines |
| SNP CrystalBridge | Migration platform | $50K+ | Selective data migration | Large cutover projects |
| Syniti ADM | Data management | $100K+ | Data quality and MDM | Complex governance needs |
Choosing between native and third-party tools comes down to scope and budget. Native connectors lower cost and setup effort, while third-party options offer deeper SAP coverage and advanced transformation.
Automation ties it together. Use Data Factory triggers and pipelines to schedule extractions, orchestrate delta loads, and load Parquet files into Delta Lake tables. One manufacturer cut migration time from 12 to 7 months using Xtract Universal alongside Fabric pipelines.
Execution Roadmap and Change Management
A phased rollout over 6-12 months, starting with a pilot on one SAP module (e.g., FI), minimizes disruption and builds internal confidence. Splitting the SAP to Microsoft Fabric migration into controlled waves lets teams learn from each stage before expanding scope.
Technical execution matters, but people and process readiness often decide whether enterprise modernization succeeds. Plan for communication, training, and governance from day one.
The following sections cover the rollout sequence, cutover planning, and the upskilling needed to sustain a Fabric-based analytics platform.
Phased Rollout and Cutover Planning
Phase 1: Migrate SAP BW data to Fabric Lakehouse (3 months); Phase 2: Integrate ECC via CDC (4 months); Phase 3: Decommission legacy (2 months). Each phase should have clear objectives, deliverables, and exit criteria before the next begins.
Phase 1 focuses on extracting SAP BW data into OneLake as Delta Lake or Parquet files, rebuilding ETL logic in Fabric pipelines and notebooks, and validating data quality against the source. Phase 2 introduces change data capture (CDC) from SAP ERP, often through SAP Landscape Transformation (SLT) or Operational Data Provisioning (ODP), to keep Fabric lakehouse tables synchronized. Phase 3 retires legacy systems once reconciliation confirms parity.
A Gantt chart helps visualize dependencies across these phases, showing parallel workstreams like data integration, semantic model development, and testing. Milestones typically include pilot sign-off, first production report, CDC go-live, and final decommissioning approval.
For cutover, plan a 48-hour freeze on source system changes, with a documented rollback strategy in case validation fails. Common pitfalls include underestimating data volumes, skipping user acceptance testing, and assuming CDC latency is negligible.
- Confirm freeze window and stakeholder sign-off
- Verify full and delta load completion
- Run row counts and reconciliation checks
- Validate Power BI semantic models and DirectLake refresh
- Execute rollback test if thresholds are missed
- Obtain business owner approval before unfreezing
Upskilling Teams and Driving Adoption
Train SAP ABAP developers on Fabric Spark and Power BI, and certify 10-15 champions to drive adoption across business units. This blend of technical reskilling and peer advocacy keeps momentum after go-live.
Start with a skills assessment comparing current ABAP, RFC, and BAPI expertise against target skills in PySpark, SQL, T-SQL, and DAX. Build learning paths using Microsoft Learn and other structured platforms, then reinforce them with hands-on labs in Fabric workspaces.
Establish a Center of Excellence (CoE) to set standards for data governance, semantic models, and Fabric capacity management. Run hackathons and lunch-and-learns to build familiarity, and track adoption through Power BI usage metrics and workspace activity.
| Role | Current Skills | Target Skills | Training Plan |
|---|---|---|---|
| ABAP Developer | ABAP, SAP extractors | PySpark, Fabric notebooks | Microsoft Learn modules plus CoE labs |
| Data Engineer | ETL, SAP Data Services | Fabric pipelines, Delta Lake | Hands-on CDC and orchestration workshops |
| BI Developer | BusinessObjects, SQL | Power BI, DAX, DirectLake | Semantic model and star schema training |
| Data Steward | Manual governance | Microsoft Purview, lineage | Governance and catalog certification |
A telecom company upskilled 50 developers in 3 months, achieving 80% adoption within 6 months. The pattern is repeatable: assess gaps, train in cohorts, and let certified champions carry the message into each business unit.
Measuring Success and Next Steps
Track KPIs like query performance (aim for sub-second), cost per TB (target <$200), and user adoption (80% active users) to measure migration success. A migration from SAP ERP to Microsoft Fabric only proves its value when you can show consistent, repeatable numbers over time. Define your baseline before cutover, then compare against it monthly.
Choose metrics that map directly to business outcomes, not just technical vanity figures. Leaders in enterprise modernization typically settle on five or six core indicators and report them on a single dashboard. That keeps the conversation focused on progress rather than noise.
Set targets that are ambitious but realistic for your workload profile. The table below offers a starting template you can adapt to your own SAP and Fabric environment.
| KPI | What It Measures | Target | Review Cadence |
|---|---|---|---|
| Query performance | Average and 95th percentile response time on key reports | Sub-second for common queries, down from minutes | Weekly |
| Total cost of ownership | Combined storage, compute, and licensing spend | 30% reduction year-over-year | Monthly |
| Data freshness | Latency between source change and availability | Under 1 hour for most pipelines | Daily |
| User adoption | Monthly active users on Fabric and Power BI assets | 80% of licensed users active | Monthly |
| Data quality | Error, rejection, and reconciliation rates | Error rate below 1% | Weekly |
| Cost per TB | Blended storage and compute cost per terabyte | Under $200 | Monthly |
Build the dashboard in Power BI using a semantic model over your Fabric lakehouse or warehouse. DirectLake mode gives near real-time visuals on Delta Lake tables without duplicating data, while Import mode suits slower-moving aggregates. Keep the layout simple: a KPI strip at the top, trend lines in the middle, and drill-through pages for pipeline-level detail.
Feed the dashboard from a small set of curated tables. Pipeline run logs, load timestamps, row counts, and rejection records from Fabric pipelines and notebooks give you freshness and quality signals. Usage telemetry from Power BI covers adoption, and capacity metrics from Microsoft Fabric capacity monitoring cover cost.
Include a data lineage view sourced from Microsoft Purview so reviewers can trace any number back to its origin. This also supports governance and audit needs such as SOX and GDPR reporting. A dashboard nobody trusts is worse than no dashboard at all.
Once the numbers stabilize, shift from measuring the migration to improving it. Continuous optimization means tuning Spark jobs, right-sizing capacity, and refining incremental load patterns using change data capture. Small, steady gains in cost and speed compound over quarters.
Next, expand scope to other SAP modules and sources. Many teams start with finance or sales data, then add SAP BW, SAP BusinessObjects, or SAP S/4HANA CDS views through Operational Data Provisioning and SLT connectors. Each new source tests whether your data integration patterns hold up at scale.
Then explore AI integration with Fabric. Copilot experiences, Fabric notebooks, and machine learning workloads can sit directly on the same OneLake data your reports use. That removes the copy-and-move cycle between analytics and data science teams.
Keep governance and cost management running in parallel throughout. Assign workspace owners, enforce row-level and column-level security, apply data masking where needed, and review capacity usage every month. Treat the dashboard as a living tool, not a one-time deliverable.
Frequently Asked Questions
Why would an enterprise migrate from SAP to Microsoft Fabric instead of staying on its existing SAP data stack?
Many organizations run SAP for core ERP processes but struggle to combine that data with information from CRM, IoT, supply chain, and other systems for enterprise-wide analytics. Migrating SAP data into Microsoft Fabric creates a unified lakehouse where SAP and non-SAP data coexist under one governance and security model. This is a core driver behind Accelerating Enterprise Modernization: SAP to Microsoft Fabric Migration, because it removes data silos, reduces reliance on custom ABAP extracts, and lets teams use Power BI, Azure Synapse, and AI services directly on SAP-sourced data without duplicating infrastructure.
How does data actually get from SAP into Microsoft Fabric?
There are several proven paths. For batch and historical loads, tools like Azure Data Factory, Fabric Data Factory pipelines, or SAP’s ODP/ODQ connectors can extract from SAP ECC or S/4HANA. For near real-time needs, change data capture (CDC) via SAP SLT, ODP, or third-party connectors streams delta records into Fabric’s OneLake. Many enterprises also use Datasphere or Azure Synapse Link for SAP as an intermediate layer. The right mix depends on latency requirements, SAP module, and data volume – a key design decision in any Accelerating Enterprise Modernization: SAP to Microsoft Fabric Migration program.
What are the biggest challenges during an SAP to Microsoft Fabric migration?
The most common challenges are semantic mapping (SAP’s complex tables, currencies, units, and hierarchies rarely translate one-to-one), preserving business logic embedded in ABAP, managing historical data volume, and maintaining security and compliance across the move. SAP’s proprietary structures also require careful handling of master data like customers, vendors, and materials. Successful Accelerating Enterprise Modernization: SAP to Microsoft Fabric Migration initiatives address these early with a data model blueprint, a clear cutover strategy, and validation against SAP reports before decommissioning legacy extracts.
How long does a typical SAP to Microsoft Fabric migration take?
Timelines vary widely by scope. A focused migration of a few SAP modules into Fabric for reporting can take 3-6 months. A full enterprise-scale migration covering finance, supply chain, HR, and custom ABAP logic often takes 12-24 months when done in phases. Most organizations adopt a wave-based approach: migrate high-value domains first, prove value with Power BI dashboards, then expand. This phased model is central to Accelerating Enterprise Modernization: SAP to Microsoft Fabric Migration, since it delivers early wins while reducing risk on the larger transformation.
What skills does my team need for this migration?
You will need a blend of SAP functional knowledge (to interpret tables, modules, and business rules), data engineering skills in Spark, SQL, and Fabric pipelines, and governance expertise for OneLake, Purview, and security. Power BI and semantic modeling skills matter for the consumption layer, and DevOps or CI/CD experience helps manage deployment. Many enterprises bridge gaps by pairing internal SAP experts with Fabric specialists or partners. Building this blended capability is one of the practical pillars of Accelerating Enterprise Modernization: SAP to Microsoft Fabric Migration.
What business benefits can we expect after migrating SAP data to Microsoft Fabric?
Expect faster time-to-insight because data is no longer trapped in SAP-only reporting tools, lower total cost of ownership by consolidating analytics platforms, and better scalability through OneLake’s unified storage. Teams gain AI and machine learning capabilities directly on SAP data, improved governance via Microsoft Purview, and self-service analytics for business users. Organizations that succeed with Accelerating Enterprise Modernization: SAP to Microsoft Fabric Migration typically report shorter reporting cycles, reduced extract maintenance, and a stronger foundation for future AI-driven enterprise initiatives.
